In this article, we will learn how we can create our custom piechart using SVG and javascript, which is totally vector, it allows high-quality graphics that scale without losing resolutions, we have to enter the values in pie charts and on page load the library will create a beautiful pie chart on the page with these different values and angles. which is very similar to the amchart , the amchart is a paid version.
Structure of a Pie Chart
A pie chart is composed of slices that represent different proportions of a whole. Each slice’s angle corresponds to its percentage of the total data set. The basic components of a pie chart include:
- Data Values: The numerical values that will be represented as slices.
- Angles: Each slice’s angle is determined by its value relative to the total sum of all values.
- Colors: Each slice can have a distinct color for better visual differentiation.
Calculating Angles
To create a pie chart, you need to calculate the angle for each slice based on its value. The formula for calculating the angle is:
Angle=(ValueTotal)×360Angle=(TotalValue)×360
Where:
- Value is the data point you want to represent.
- Total is the sum of all data points.
Demo Javascript Pie Charts
Implementing a Pie Chart with SVG
Here’s a step-by-step guide to creating a simple pie chart using SVG and JavaScript.
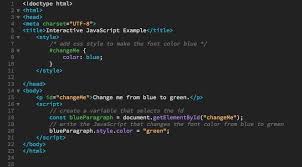
Step 1: Set Up Your HTML
 <div class="svg-container">
            <!--<svg id="pie-chart" viewBox="0 0 300 150">

                <defs>
                    <marker id="arrowhead" markerWidth="6" markerHeight="6" refX="3" refY="3" orient="auto" markerUnits="strokeWidth">
                        <circle cx="3" cy="3" r="3" fill="#000"/>
                    </marker>
                </defs>
            </svg>-->

        </div>
Step 2: Create Your JavaScript File
Next, create a pieChart.js file where you will write the JavaScript code to generate the pie chart.
document.addEventListener("DOMContentLoaded", () => {
const svg = document.getElementById("pie-chart");
const radius = 100; // Radius of the semi-circle
const cx = 150; // Center x of the semi-circle
const cy = 130; // Center y of the semi-circle
const startAngle = -180; // Start angle in degrees
const endAngle = 0; // End angle in degrees
// Combined array for colors, percentages, labels, and font sizes
const data = [
{
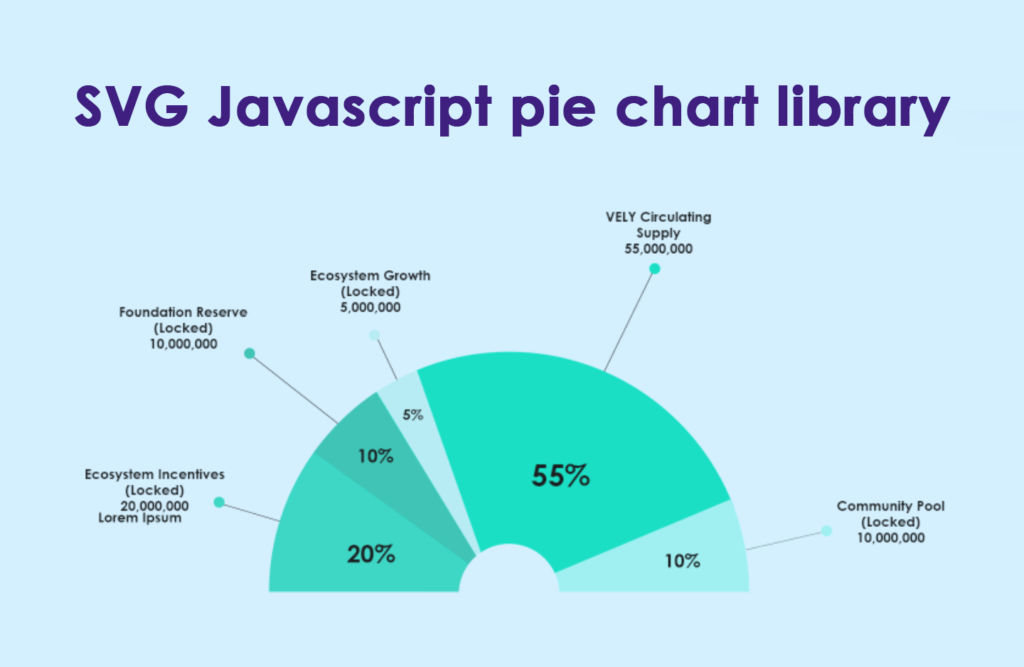
percentage: 20,
color: "#4be3c5",
internalLabel: "20%",
internalFontSize: "7px",
externalLabel: "Ecosystem Incentives (Locked) 20,000,000",
externalFontSize: "3.5px",
},
{
percentage: 10,
color: "#4dd0b6",
internalLabel: "10%",
internalFontSize: "6px",
externalLabel: "Foundation Reserve (Locked) 10,000,000",
externalFontSize: "3.5px",
},
{
percentage: 5,
color: "#dcfbf5",
internalLabel: "5%",
internalFontSize: "5px",
externalLabel: "Ecosystem Growth(Locked) 5,000,000",
externalFontSize: "3.5px",
},
{
percentage: 55,
color: "#1fedc4",
internalLabel: "55%",
internalFontSize: "16px",
externalLabel: "VELY Circulating Supply 55,000,000",
externalFontSize: "3.5px",
},
{
percentage: 10,
color: "#c0fff2",
internalLabel: "10%",
internalFontSize: "7px",
externalLabel: "Community Pool (Locked) 10,000,000",
externalFontSize: "3.5px",
},
];
const total = data.reduce((a, b) => a + b.percentage, 0);
let currentAngle = startAngle;
// Create paths, lines, and text elements
const paths = [];
const lines = [];
const internalTexts = [];
const externalTexts = [];
function splitText(text, maxWidth) {
const words = text.split(' ');
let line = '';
let lines = [];
words.forEach(word => {
const testLine = line + word + ' ';
const testText = document.createElementNS('http://www.w3.org/2000/svg', 'text');
testText.setAttribute('class', 'label-text');
testText.style.fontSize = '14px';
testText.textContent = testLine;
svg.appendChild(testText);
const { width } = testText.getBBox();
svg.removeChild(testText);
if (width > maxWidth) {
lines.push(line.trim());
line = word + ' ';
} else {
line = testLine;
}
});
lines.push(line.trim());
return lines;
}
const maxWidth = 100; // Max width for line wrapping
data.forEach((item, index) => {
const angle = (item.percentage / total) * (endAngle - startAngle);
const endAngleRad = (currentAngle + angle) * (Math.PI / 180);
const startAngleRad = currentAngle * (Math.PI / 180);
const x1 = cx + radius * Math.cos(startAngleRad);
const y1 = cy + radius * Math.sin(startAngleRad);
const x2 = cx + radius * Math.cos(endAngleRad);
const y2 = cy + radius * Math.sin(endAngleRad);
const largeArcFlag = angle > 180 ? 1 : 0;
const pathData = `
M ${cx} ${cy}
L ${x1} ${y1}
A ${radius} ${radius} 0 ${largeArcFlag} 1 ${x2} ${y2}
Z
`;
const path = document.createElementNS('http://www.w3.org/2000/svg', 'path');
path.setAttribute('d', pathData.trim());
path.setAttribute('fill', item.color);
path.setAttribute('class', 'slice'); // Add class for animation
svg.appendChild(path);
// Create internal text element for label inside the slice
const internalText = document.createElementNS('http://www.w3.org/2000/svg', 'text');
internalText.setAttribute('class', 'label-text');
internalText.style.fontSize = item.internalFontSize;
internalText.textContent = item.internalLabel;
svg.appendChild(internalText);
// Create line element for external label
const line = document.createElementNS('http://www.w3.org/2000/svg', 'line');
line.setAttribute('class', 'label-line');
svg.appendChild(line);
// Create external label text elements
const externalLines = splitText(item.externalLabel, maxWidth);
const externalTextGroup = document.createElementNS('http://www.w3.org/2000/svg', 'g');
svg.appendChild(externalTextGroup);
externalLines.forEach((textLine, i) => {
const externalText = document.createElementNS('http://www.w3.org/2000/svg', 'text');
externalText.setAttribute('class', 'label-text');
externalText.style.fontSize = item.externalFontSize;
externalText.textContent = textLine;
externalTextGroup.appendChild(externalText);
});
paths.push({
path,
startAngle: currentAngle,
endAngle: currentAngle + angle,
index
});
lines.push({
line,
startAngle: currentAngle,
endAngle: currentAngle + angle,
index
});
internalTexts.push({
internalText,
percentage: item.percentage,
startAngle: currentAngle,
endAngle: currentAngle + angle
});
externalTexts.push({
externalTextGroup,
percentage: item.percentage,
startAngle: currentAngle,
endAngle: currentAngle + angle,
label: item.externalLabel
});
currentAngle += angle;
});
const animationDuration = 500; // Duration of animation in milliseconds
const animationDelay = 200; // Delay between each slice animation in milliseconds
let startTime = performance.now();
function animate(time) {
const elapsed = time - startTime;
const progress = Math.min(elapsed / animationDuration, 1);
paths.forEach(({ path, startAngle, endAngle, index }) => {
const currentProgress = progress * (endAngle - startAngle);
const currentEndAngle = startAngle + currentProgress;
const endAngleRad = currentEndAngle * (Math.PI / 180);
const startAngleRad = startAngle * (Math.PI / 180);
const x1 = cx + radius * Math.cos(startAngleRad);
const y1 = cy + radius * Math.sin(startAngleRad);
const x2 = cx + radius * Math.cos(endAngleRad);
const y2 = cy + radius * Math.sin(endAngleRad);
const largeArcFlag = currentProgress > 180 ? 1 : 0;
const pathData = `
M ${cx} ${cy}
L ${x1} ${y1}
A ${radius} ${radius} 0 ${largeArcFlag} 1 ${x2} ${y2}
Z
`;
path.setAttribute('d', pathData.trim());
path.style.opacity = 1;
// Update internal text inside the slice
const midAngle = startAngle + currentProgress / 2;
const midAngleRad = midAngle * (Math.PI / 180);
internalTexts[index].internalText.setAttribute('x', cx + (radius / 2) * Math.cos(midAngleRad));
internalTexts[index].internalText.setAttribute('y', cy + (radius / 2) * Math.sin(midAngleRad));
// Update line element
const midAngleForLine = startAngle + (currentProgress / 2);
const midAngleRadForLine = midAngleForLine * (Math.PI / 180);
const lineStartX = cx + (radius) * Math.cos(midAngleRadForLine);
const lineStartY = cy + (radius) * Math.sin(midAngleRadForLine);
// Shorten the line to bring the label closer
const lineEndX = cx + (radius * 1.25) * Math.cos(midAngleRadForLine);
const lineEndY = cy + (radius * 1.25) * Math.sin(midAngleRadForLine);
lines[index].line.setAttribute('x1', lineStartX);
lines[index].line.setAttribute('y1', lineStartY);
lines[index].line.setAttribute('x2', lineEndX);
lines[index].line.setAttribute('y2', lineEndY);
// Update external label
externalTexts[index].externalTextGroup.querySelectorAll('text').forEach((textElement, i) => {
const labelX = lineEndX + (lineEndX > lineStartX ? 10 : -10);
const labelY = lineEndY + (i * 5); // Vertical spacing for multi-line labels
textElement.setAttribute('x', labelX);
textElement.setAttribute('y', labelY - 5); // Small vertical offset to move text closer to line head
});
});
// Request animation frame for the next frame
if (progress < 1) {
requestAnimationFrame(animate);
}
}
// Start animation for each slice with a delay
let delay = 1000;
data.forEach((item, index) => {
setTimeout(() => {
startTime = performance.now();
requestAnimationFrame(animate);
}, 0);
delay += animationDelay;
});
});Step 3: Set Up Your Style
  <style>
        svg {
  width: 100%; /* SVG scales to the width of the container */
  height: auto; /* Height scales proportionally */
  display: block; /* Removes extra space below SVG */
  background: none; /* Optional background color */
}

.label-line {
 stroke: #545454;
  stroke-width: .2; /* Thin line */
  marker-end: url(#arrowhead); /* Circle marker */
}

.label-text {
  fill: #000;
  text-anchor: middle;
}/* Responsive Styles */

    </style>
Settings
   const data = [
          {
            percentage: 20,
            color: "#4be3c5",
            internalLabel: "20%",
            internalFontSize: "7px",
            externalLabel: "Ecosystem Incentives (Locked) 20,000,000",
            externalFontSize: "3.5px",
          },
          {
            percentage: 10,
            color: "#4dd0b6",
            internalLabel: "10%",
            internalFontSize: "6px",
            externalLabel: "Foundation Reserve (Locked) 10,000,000",
            externalFontSize: "3.5px",
          },
          {
            percentage: 5,
            color: "#dcfbf5",
            internalLabel: "5%",
            internalFontSize: "5px",
            externalLabel: "Ecosystem Growth(Locked) 5,000,000",
            externalFontSize: "3.5px",
          },
          {
            percentage: 55,
            color: "#1fedc4",
            internalLabel: "55%",
            internalFontSize: "16px",
            externalLabel: "VELY Circulating Supply 55,000,000",
            externalFontSize: "3.5px",
          },
          {
            percentage: 10,
            color: "#c0fff2",
            internalLabel: "10%",
            internalFontSize: "7px",
            externalLabel: "Community Pool (Locked) 10,000,000",
            externalFontSize: "3.5px",
          },


        ];
To set font size of each label and the percentage of each slice you can edit the above settings , this settings are already available in the library above
percentage: 5 : slice percentage
color: “#dcfbf5” : slice color
internalLabel: “5%” : text inside the slice
internalFontSize: “5px” : Font size inside the slice
externalLabel: “Text outside the slice”,
externalFontSize: “3.5px” : font size out side the slice
Conclusion
Creating a pie chart with SVG in JavaScript provides flexibility and control over your visualizations. By understanding how to manipulate SVG elements and calculate angles based on data values, you can create interactive and visually appealing charts tailored to your needs. This approach not only enhances user experience but also makes your web applications more engaging and informative.

Leave a Reply